Local-first desktop app · Windows, macOS, Linux

Every limit.Every token.One window.

UsageAtlas reads the Codex, Claude, Cursor, and OpenCode sessions already signed in on your computer and turns them into live capacity, daily activity, long-range history, and tracked cost — without a single new login.

No account. No prompts collected. Your usage data stays on your computer.

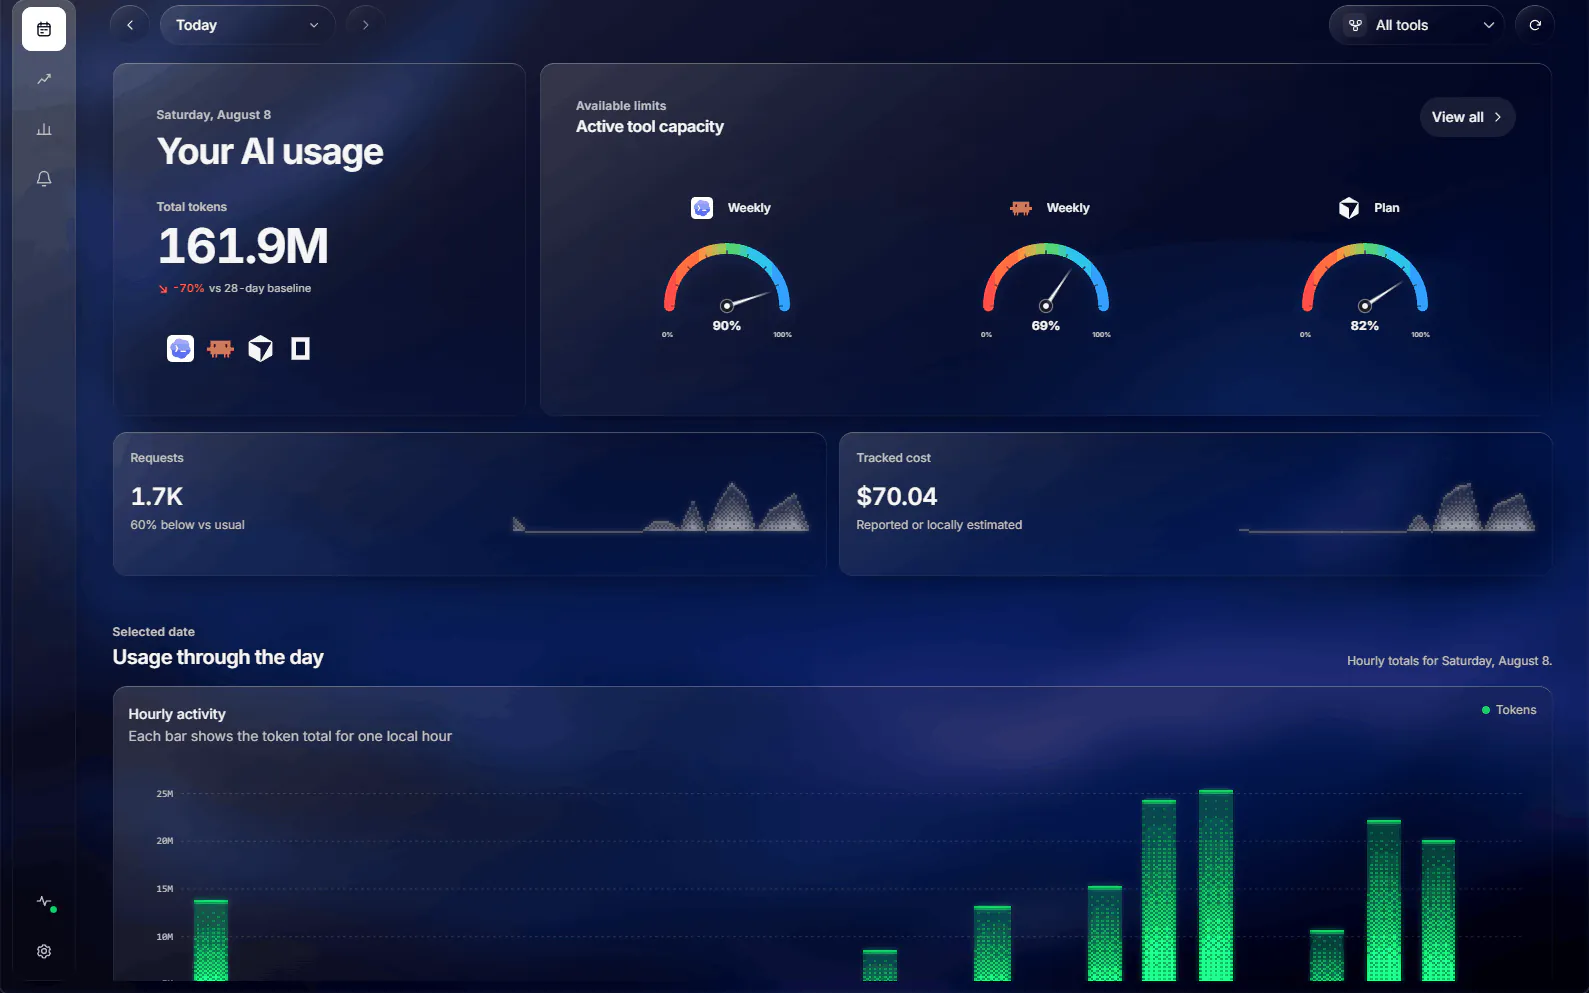
The UsageAtlas Today view: 161.9 million tokens for the day, three capacity gauges for the connected tools, requests and tracked cost, and an hourly token chart.

Sources

Four tools, read where they already live.

A provider only ships once it has complete authentication, structured error handling, and deterministic adapter tests. Nothing here is a placeholder.

  • Codex

    Read through the signed-in Codex CLI's own local app-server API.

    • Session window
    • Weekly window
    • Plan
    • Credits
  • Claude

    Uses the Claude OAuth credentials already stored on this computer.

    • 5-hour window
    • Weekly window
    • Plan
    • Extra-usage credits
  • Cursor

    Reuses your signed-in Cursor desktop session from read-only local state.

    • Plan
    • Auto + Composer
    • API
    • 90-day history
  • OpenCode

    Reads the local OpenCode database for per-step activity.

    • Tokens
    • Requests
    • Models
    • Sessions

Today

The day you are actually having.

Total tokens against your own rolling baseline, not an average user's. Then the hour that produced them, the tools that spent them, and what it cost.

  • Hour-by-hour token totals for any date you select
  • Provider mix, so you can see which tool carried the day
  • Token mix across fresh input, cache read, cache creation, and output
  • Requests and tracked cost, reported by the tool or estimated locally
Hourly activity for a single day beside a provider mix donut showing Codex at 78 percent, Claude at 22 percent, and Cursor at 1 percent, plus a token mix breakdown.
Live capacity
Every metered window your tools report, with the time it resets.
Local analytics
Tokens, requests, and cost read from sessions on this machine.
Your own baseline
Today measured against how you normally work, over a 28-day window.

History

Seven days, ninety, or everything you have collected.

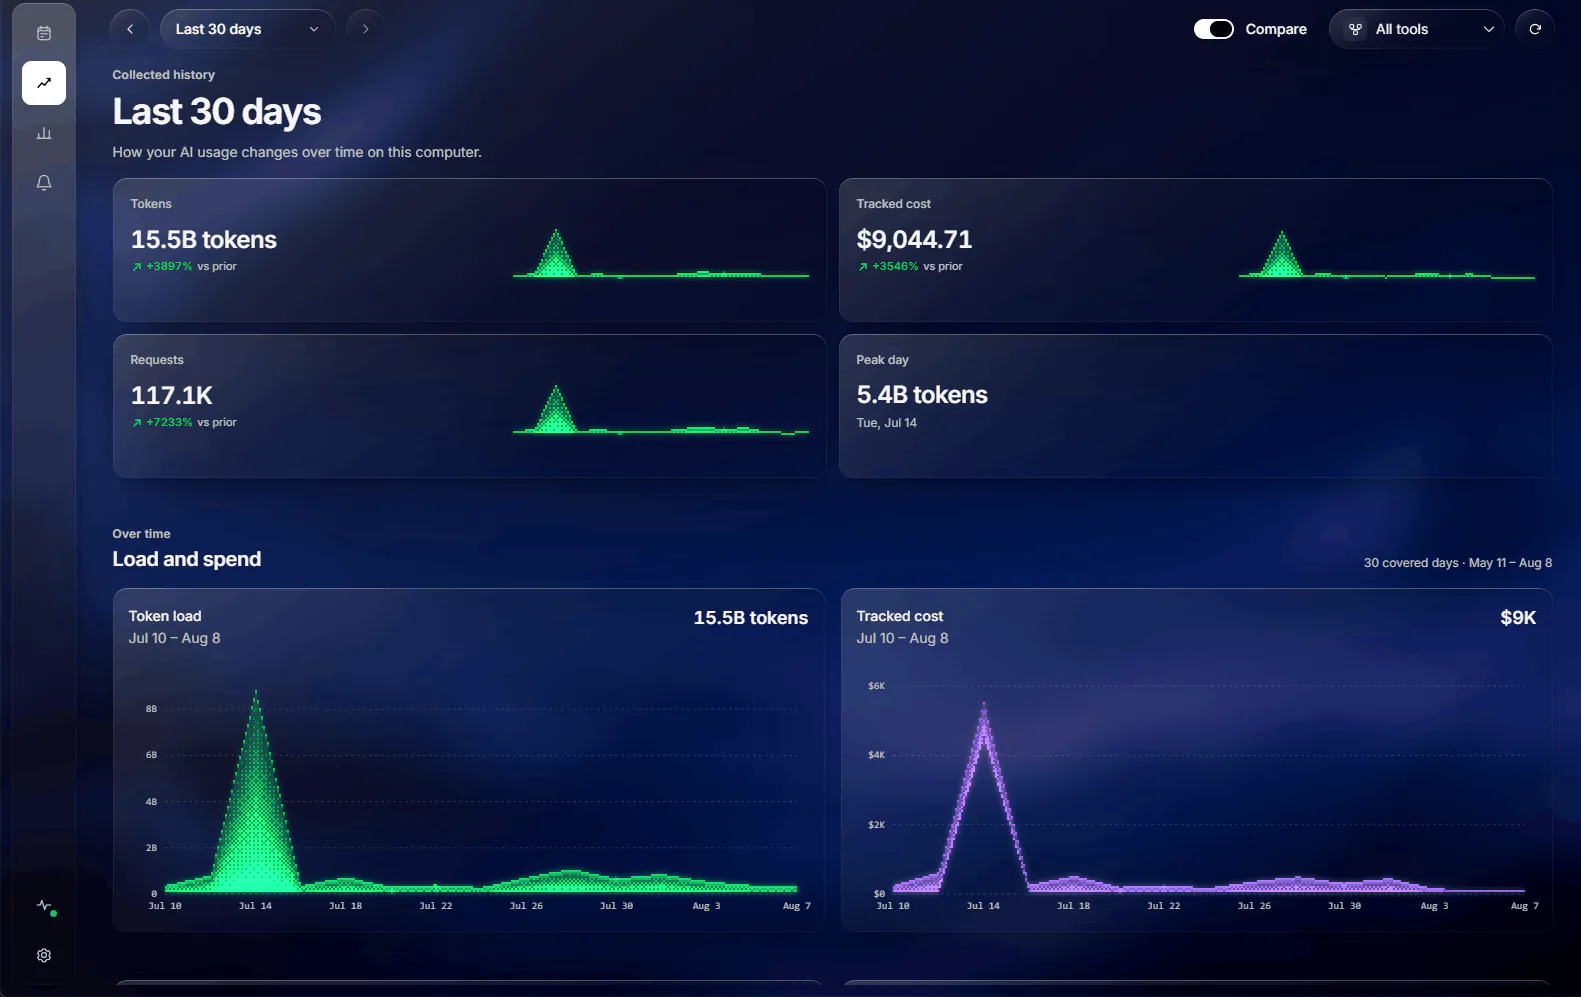
Every headline number carries its change against the period before it, so a big week reads as a big week rather than a number without a past.

  • Token load and tracked cost plotted across the range
  • Peak day, active days, and per-covered-day averages
  • Compare mode for the previous period, on or off
  • Gaps stay visibly empty — missing history is never drawn as zero
The History view over the last 30 days: 15.5 billion tokens, 9,044 dollars of tracked cost, 117.1 thousand requests, and load and spend plotted day by day.

Insights

The shape of your week.

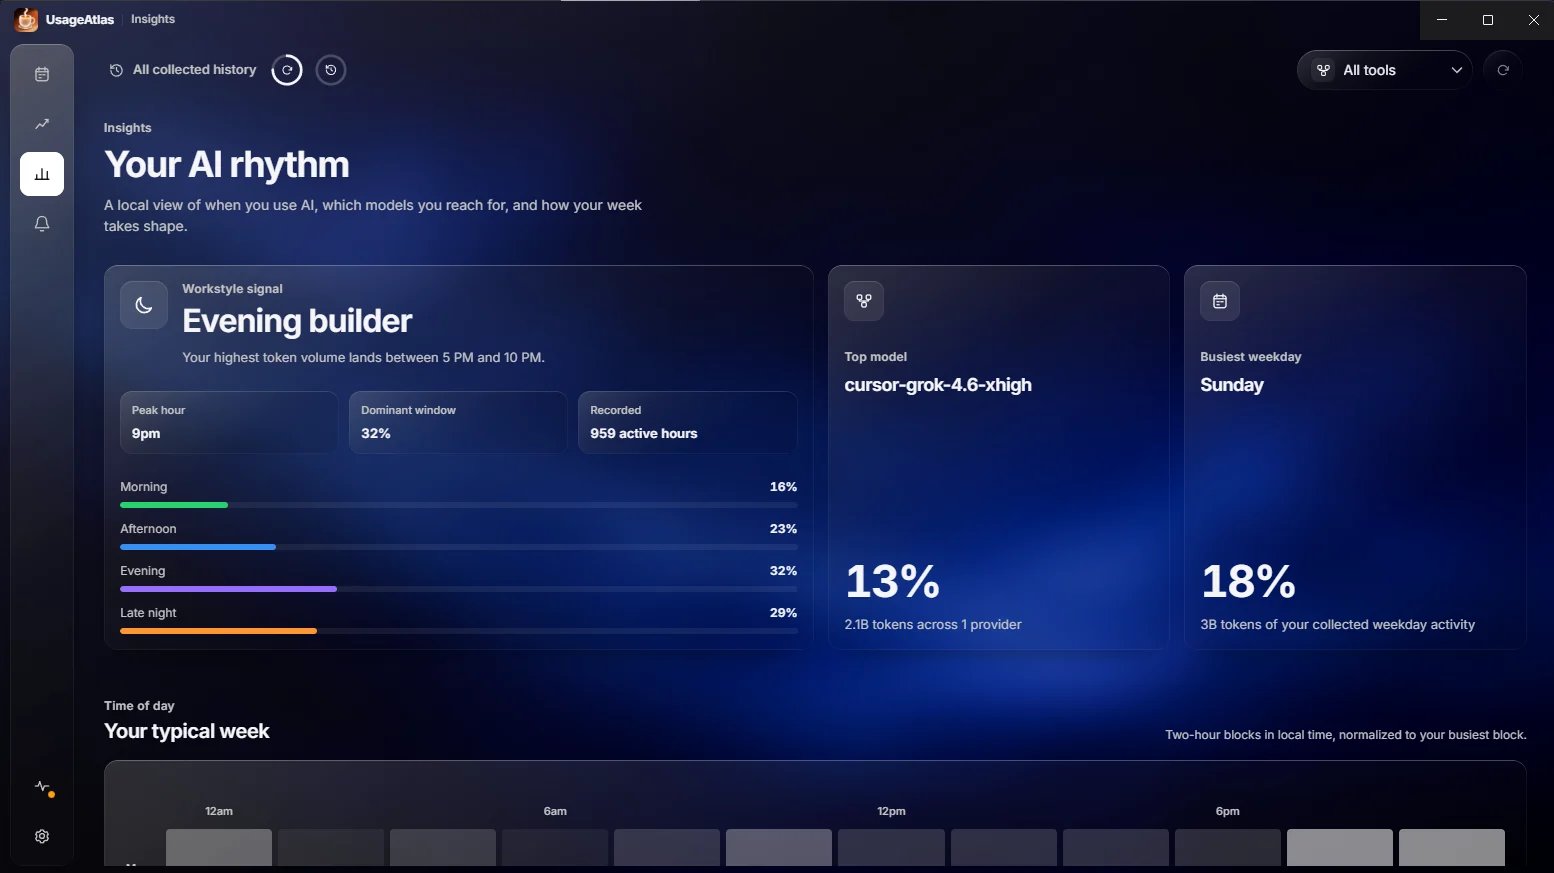
Built entirely from session history already on your disk: when you reach for AI, which models you actually use, and how the week distributes itself.

The Insights view labelling the workstyle signal as Evening builder, with peak hour 8pm, a morning to late-night split, top model, and busiest weekday.

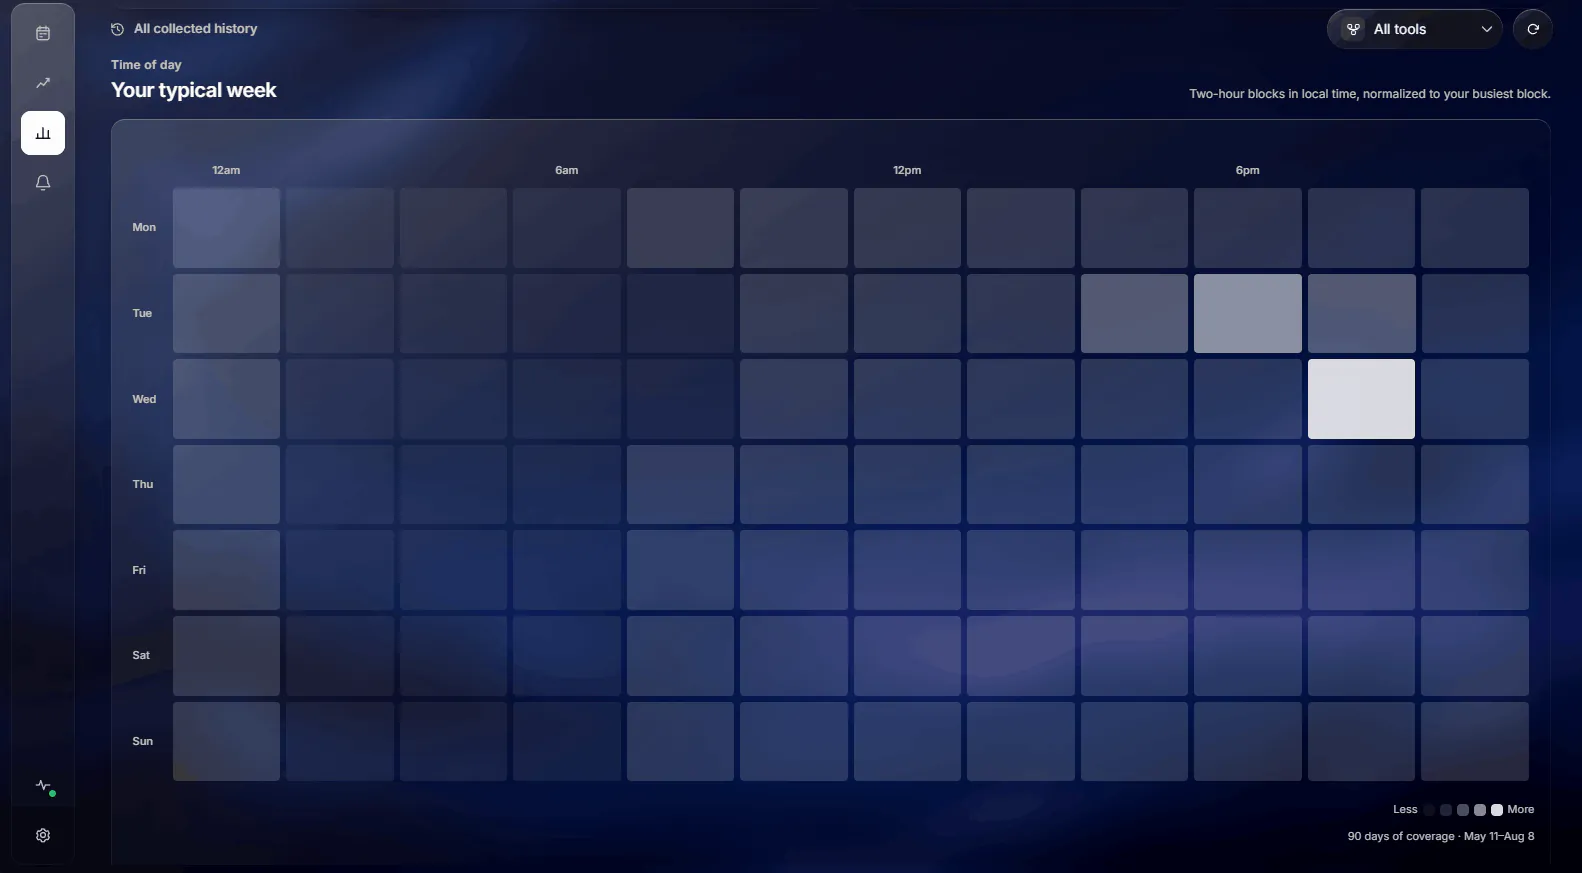
Your typical week

Two-hour blocks in local time, normalised to your busiest block, across every day the app has collected.

A weekly heatmap of AI activity in two-hour blocks, Monday through Sunday, with the brightest block on Wednesday evening.

Model mix

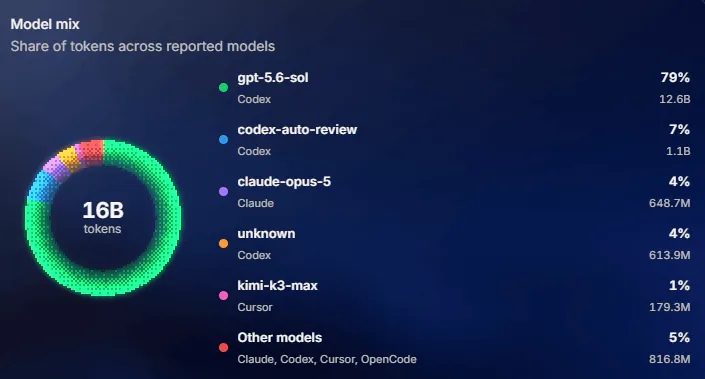
Share of tokens across every model your tools report, not just the headline one.

A model mix donut totalling 16 billion tokens, led by gpt-5.6-sol at 79 percent, then codex-auto-review, claude-opus-5, and other models.

Weekday balance

Which days carry the load, normalised to your busiest weekday.

Weekday balance bars normalised to the busiest weekday, with Tuesday at 40 percent and Wednesday at 28 percent.

Limits and alerts

Told before the wall, not after it.

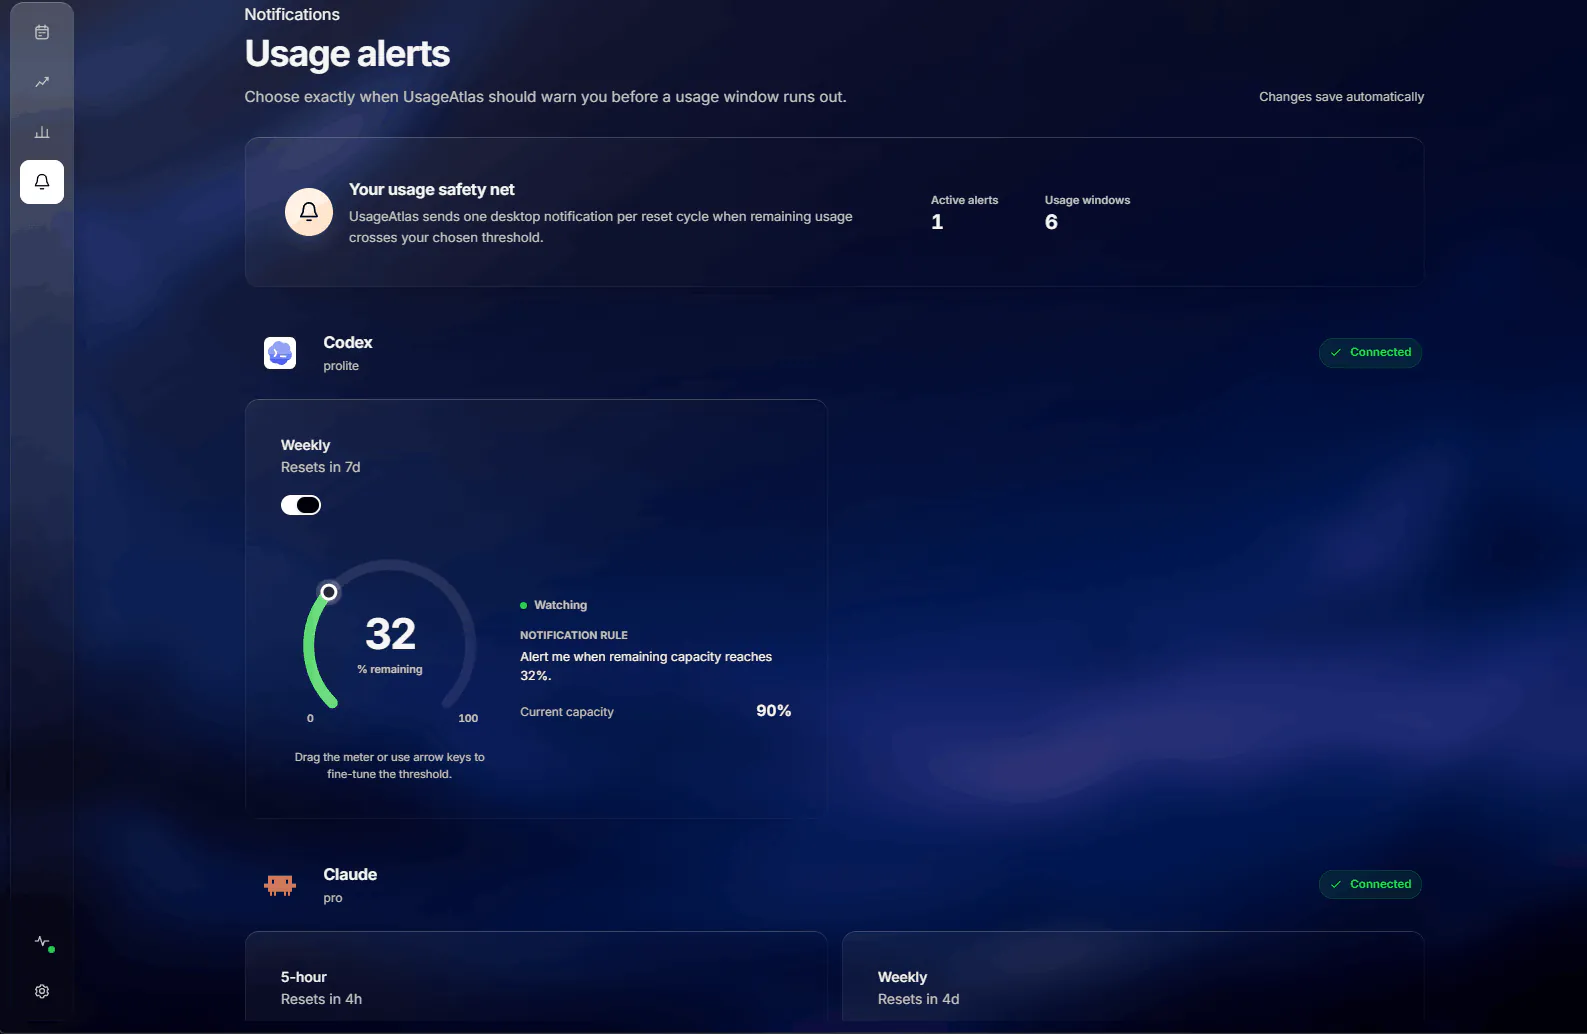
Set a remaining-capacity threshold per window, per tool. UsageAtlas sends one desktop notification per reset cycle, and opening it takes you straight to the window that triggered it.

  • Off by default — nothing notifies you until you switch it on
  • A dial per window, draggable or nudged with arrow keys
  • One notification per reset cycle, never a stream of them
  • Refreshes in the tray, so the numbers are current when you look
The Usage alerts view with one active alert across six usage windows, showing a Codex weekly window set to warn at 32 percent remaining capacity.

Every metered window, grouped by tool

Compare what is left before you route the next task.

Alert thresholds grouped by tool: Claude's 5-hour and weekly windows and Cursor's plan and Auto plus Composer windows, each with its own dial and reset time.

Controls

Two controls, and they work everywhere.

Narrow to one tool or widen to all of them, then move through days and ranges. Every view answers to the same two menus.

Filter by tool

Look at everything at once, or isolate a single tool to see what it alone is costing you.

The tool filter menu listing All tools, Codex, Claude, Cursor, and OpenCode.

Pick a day or a range

Today, yesterday, any specific date, or the last 7, 30, and 90 days — up to your full collected history.

The date menu offering Today, Yesterday, a specific date, and ranges for the last 7, 30, and 90 days or all collected history.

Local by architecture

Your usage never leaves the machine that made it.

UsageAtlas reads supported provider state on your desktop, converts it into bounded aggregates, and keeps credentials out of the interface entirely. Any source can be switched off.

  • No UsageAtlas account.It works with the tools you are already signed in to on this device.
  • No prompts, no responses.The dashboard receives bounded aggregates — tokens, requests, cost — never message content.
  • Credentials never reach the interface.A sandboxed renderer with context isolation and an allowlisted preload keeps provider access in the engine process.
  • Analytics stay off until you allow them.Optional anonymous app events only, and never provider data, usage totals, or costs.

Read the privacy policy

UsageAtlas settings: launch at login, keep running in the tray, an anonymous analytics toggle, and per-source switches for Codex, Claude, Cursor, and OpenCode.

Download

Take the full picture with you.

UsageAtlas installs locally and works with the supported tools already signed in on your computer.

Windows 10 or later

Squirrel installer with automatic updates for 64-bit Windows.

macOS, Apple silicon or Intel

Signed and notarized disk images with automatic updates.

Linux, portable AppImage

Runs on common 64-bit x86 and ARM Linux distributions.

Official releases include published checksums. Windows and macOS packages are signed before publication.

Less dashboard hopping.
More signal.

Quick enough for a glance before you start a task, deep enough for a real usage review at the end of the month.